Writing a basic script
This guide walks through writing a basic transform script using the gluestick package
Before you start
This guide assumes you have already launched a JupyterLab workspace, as described in the Transformations Overview.
Environment variables
There are several environment variables that will be available when a transformation script runs in hotglue during a sync job:
| Environment Variable | Description |
|---|---|
TENANT | ID of the tenant |
TAP | ID of the tap |
FLOW | ID of the flow |
ENV_ID | ID of the hotglue environment |
JOB_ID | ID of the job |
If you wanted to reference this in Python, you would use the os.environ variable to access the environment variables. See the sample below.
import os

tenant_id = os.environ.get("TENANT")
tap = os.environ.get("TAP")
flow_id = os.environ.get("FLOW")
env_id = os.environ.get("ENV_ID")
job_id = os.environ.get("JOB_ID")
Standard directories
In hotglue, there are three standard directories:
| Directory Path | Description |
|---|---|
sync-output | This directory contains all input data from the data source (typically CSV). |
snapshots | This directory can be used to store (snapshot) any data for the current tenant (typically JSON or CSV). |
etl-output | This directory is where you should put all output data, formatted as needed for the target your flow is using (typically JSON or CSV). |
Read the data
To start, we will import pandas and the gluestick Python package, and establish the standard input/output directories above. Note that you do not have to use the snapshots feature if you do not need to.
import gluestick as gs
import pandas as pd
import os

# Establish standard directories for hotglue
INPUT_DIR = "./sync-output"
OUTPUT_DIR = "./etl-output"
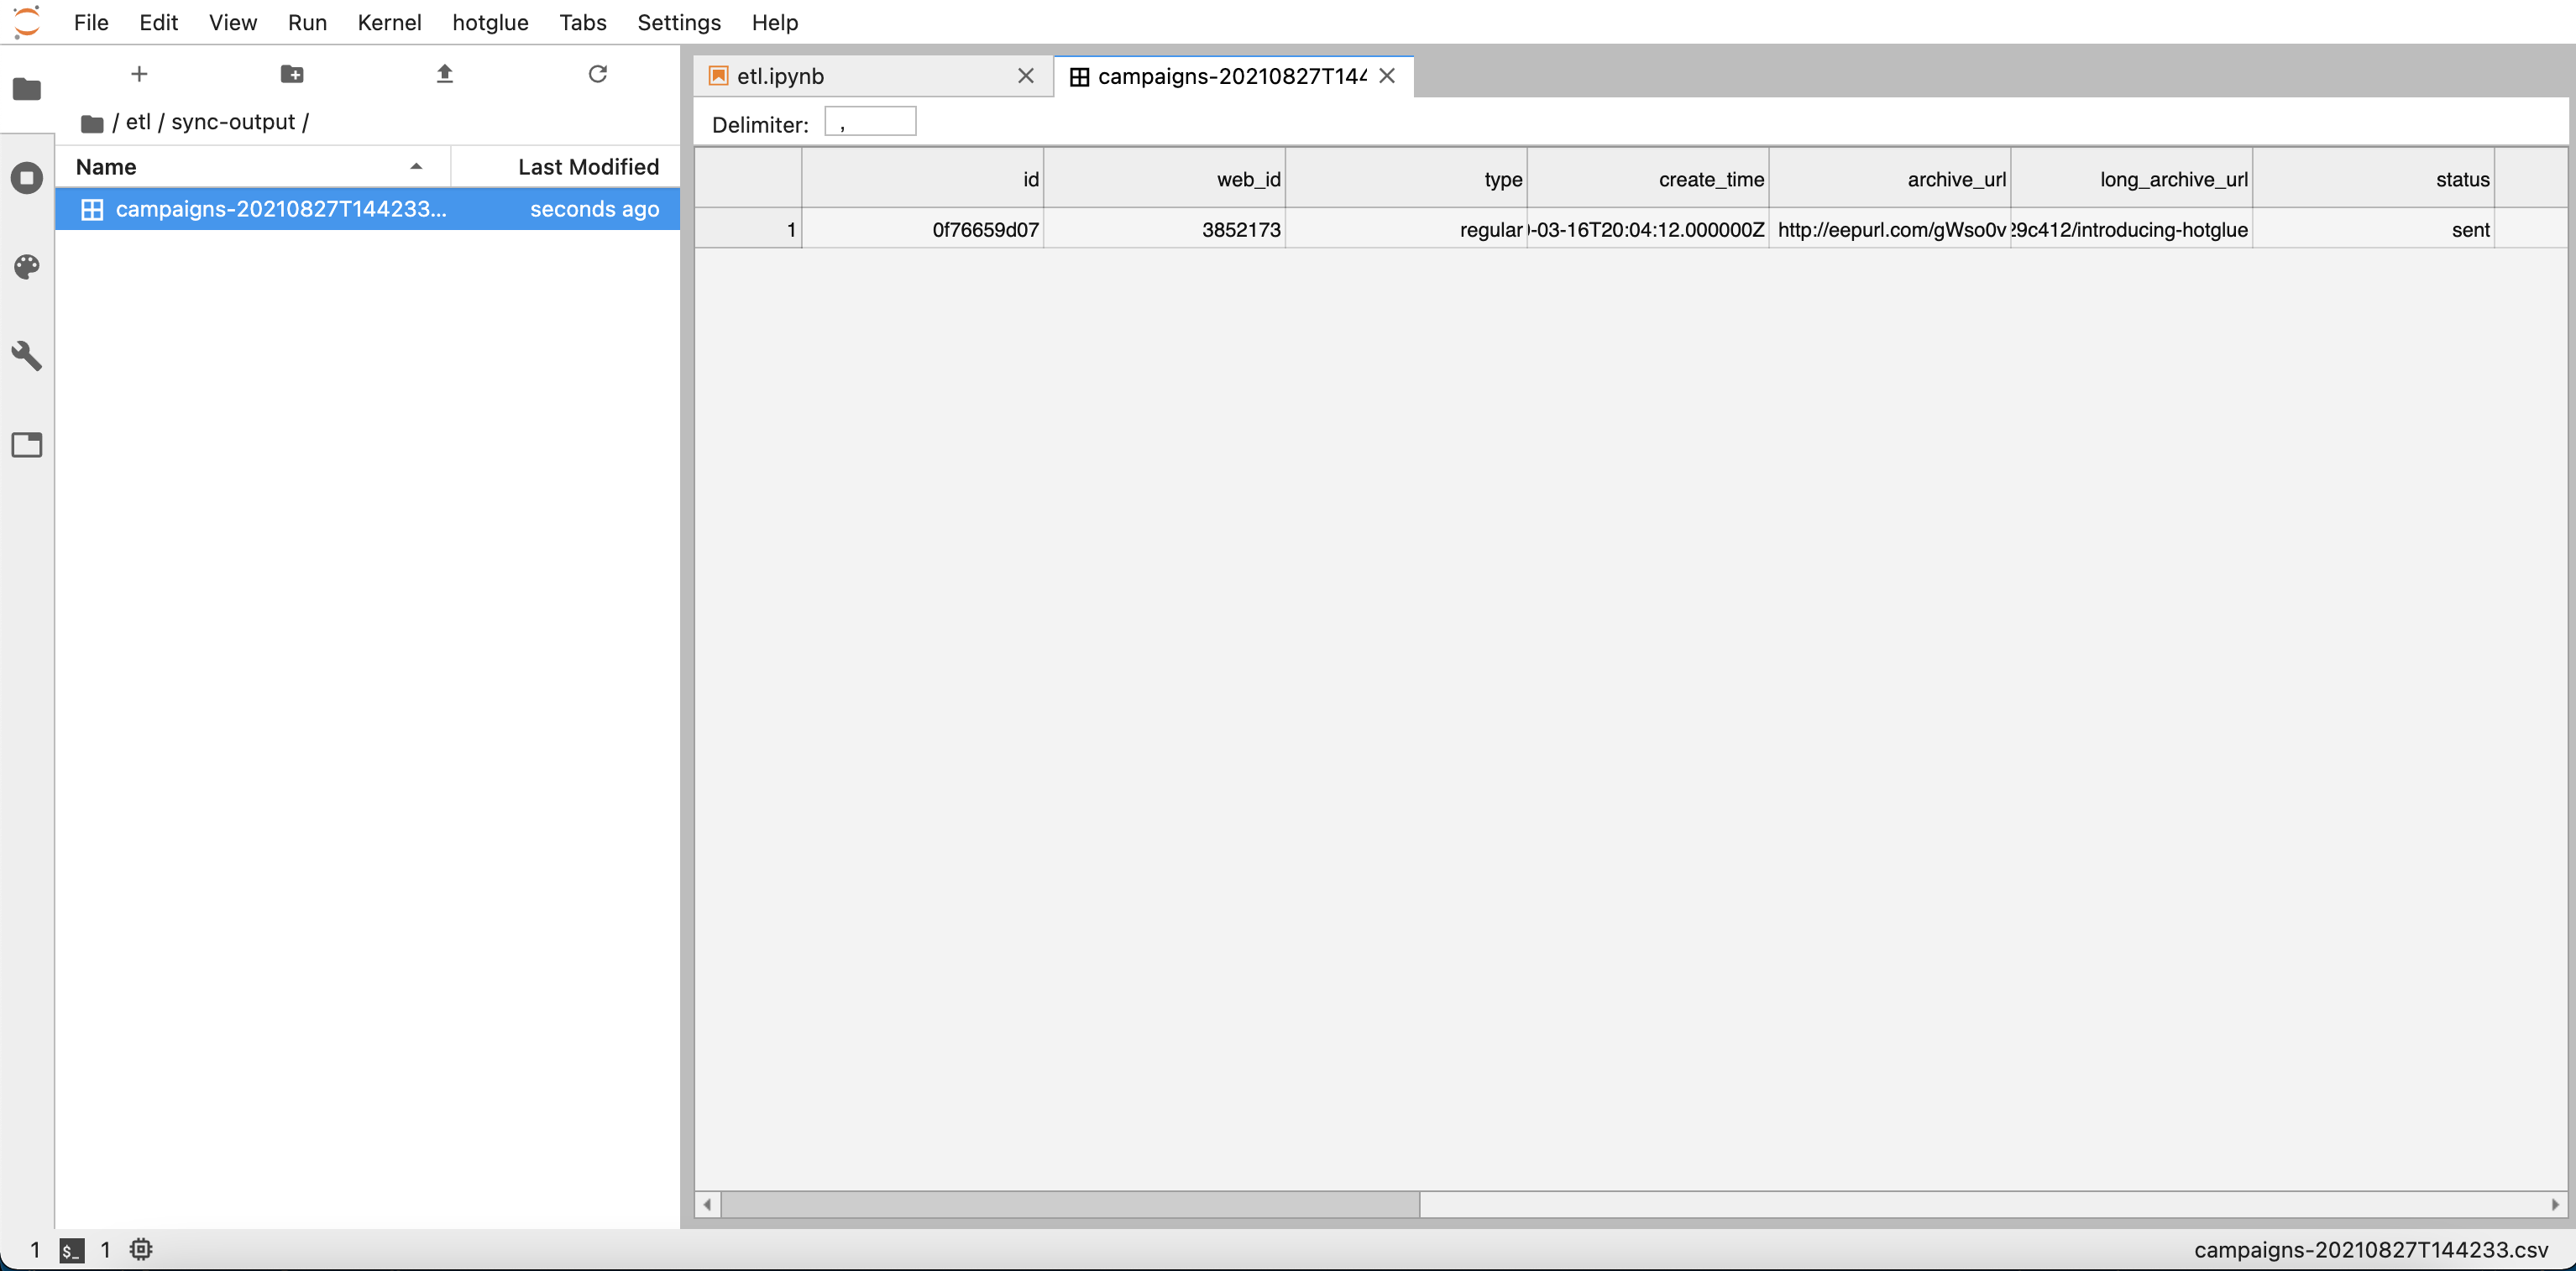
As you can see below, my sync_output folder contains a CSV file called campaigns. Learn more how to get sample data in the Debugging a script section.

Now we can go ahead and read the data in INPUT_DIR with gluestick’s read_csv_folder function.
# Read input data
input_data = gs.read_csv_folder(INPUT_DIR)
gluestick automatically parses out the timestamp in the CSV name, so we can access the campaigns data as follows:
# Get the campaigns data
campaigns = input_data["campaigns"]
campaigns.head()
By calling campaigns.head() we can preview the data

campaigns data in Jupyter
Manipulate the data
Now that you have the data as a pandas DataFrame, you can do any transformations you need to.
For this example, we will select a few of the columns: id, emails_sent, create_time, and status, and then rename them.
# Select the columns we want
campaigns = campaigns[['id', 'emails_sent', 'create_time', 'status']]

# Rename the columns
campaigns = campaigns.rename(columns={
    'id': "Id",
    'emails_sent': "Sent",
    'create_time': "CreatedAt",
    'status': "Status"
})

campaigns.head()
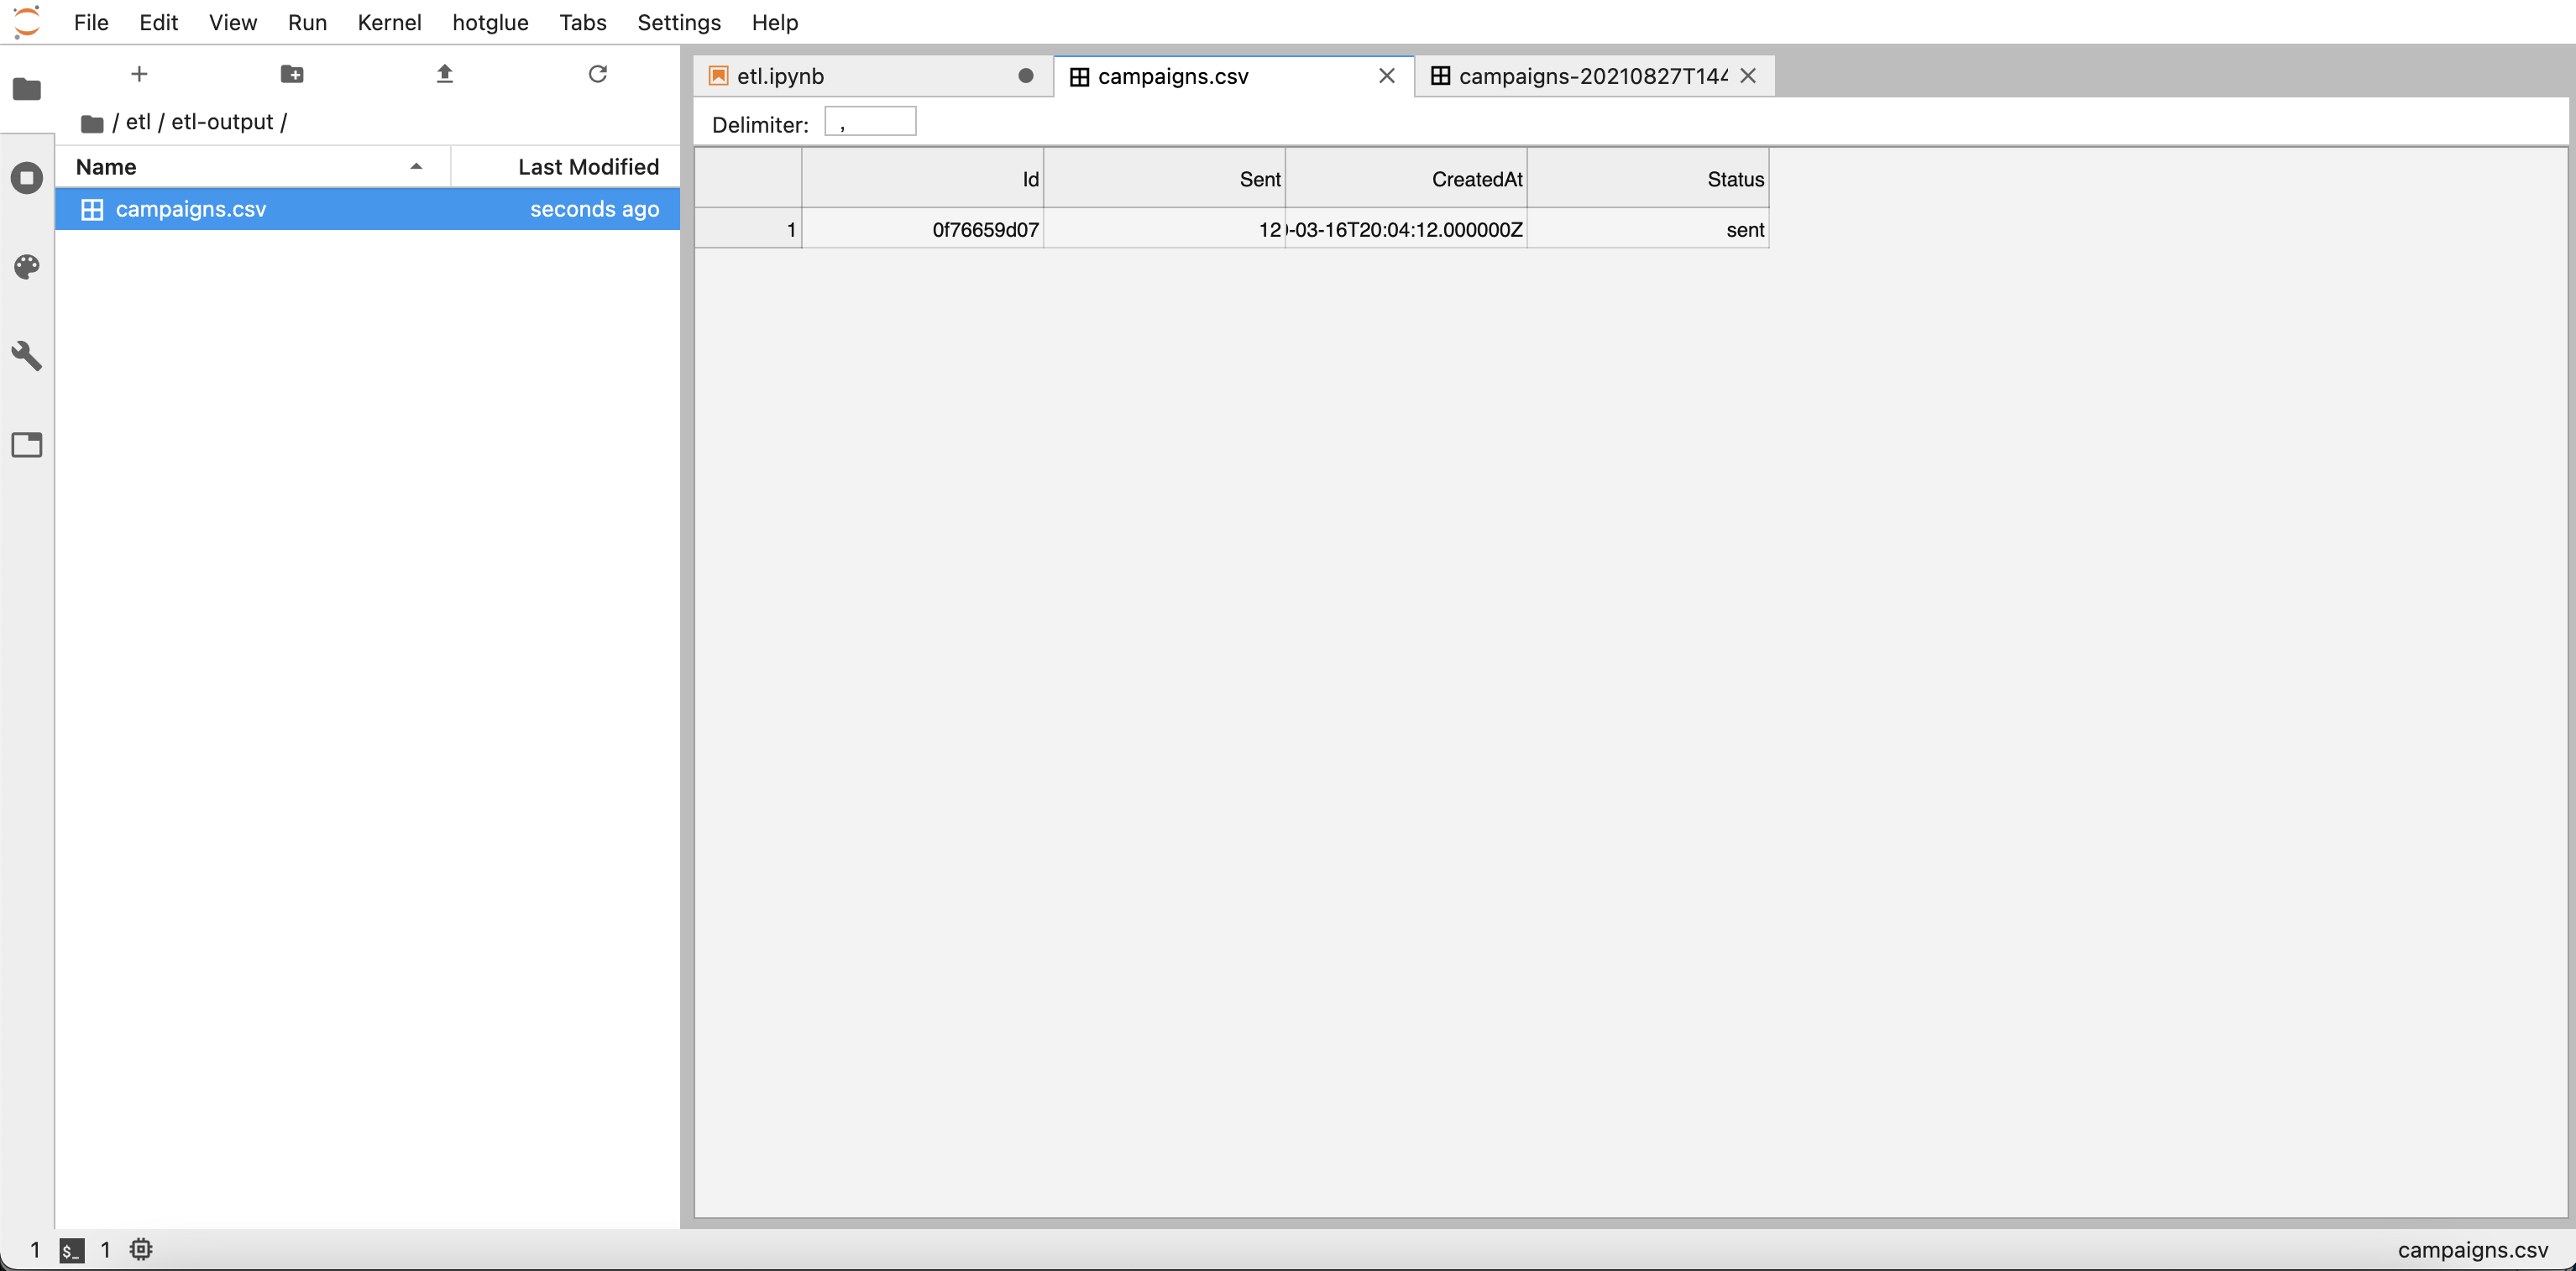
This generates the final output pictured below. You can see samples of more complex use cases on GitHub and refer to the pandas documentation.

Final output data
Write the output data
Finally, we can write the output to the standard OUTPUT_DIR using pandas to_csv function:
# Write the output
campaigns.to_csv(f"{OUTPUT_DIR}/campaigns.csv", index=False)
As pictured below, this generates the output as a CSV file in the etl-output directory:

Output CSV

